
Introduction:
The aim of this research is to attempt to either prove or disprove the usefulness of using the moving average cross over (MA Cross Over) signal as a trade entry strategy.
The test is designed to measure the trade entry signal in isolation, as a result there will be no trade management other than a simple exit strategy. The exit strategy will be a fixed price distance that is volatility adjusted. The same price distance will be used for both the take profit and stop loss exits. This will enable the test to identify the forecasting ability of the trade entry signal in isolation of trade management and more sophisticated exits signals that can lead to false positives.
“Can the entry signal forecast that the price will move x amount of distance reliably”
Scope:
I will be focusing on the BTC price data using the 1HR time frame. Other markets and/or timeframes are outside the scope of this research and may yield different results to what is shown here.
However, it is worth mentioning that I did run the same tests on the MNQ(Micro E-Mini Nasdaq) 5 min time frame, which yielded similar results.
Testing Scope:
- MA cross over entry signal
- BTC 1HR price data
Detail
The overall trading strategy will consist of the entry signal and exit signal.
Entry signal:
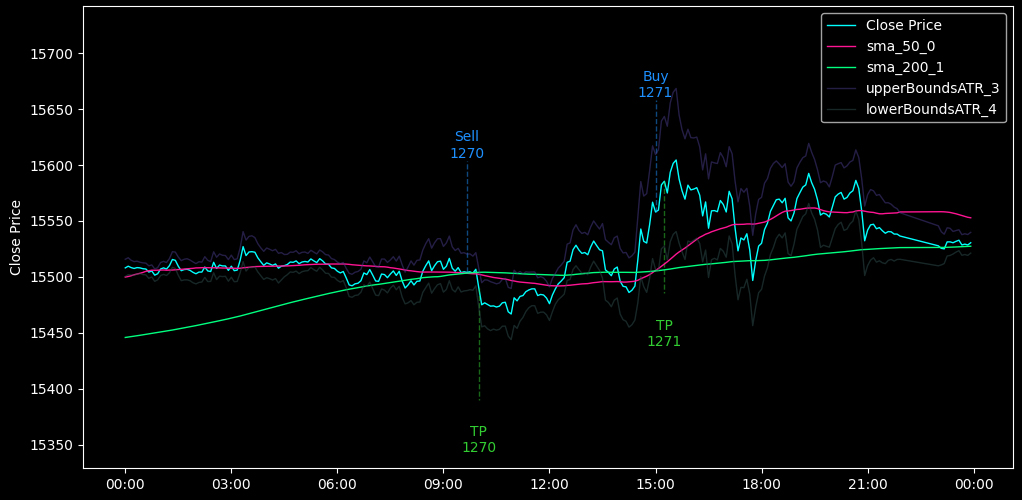
The entry signal is generated when the lines of two moving average indicators cross over each other. We will be using two simple moving average (SMA) indicators, that differ in the period that is used by each. One will be a larger period of 200 and the other will be a smaller period of 50.
- A: SMA w/ period of 200 (slow SMA)
- B: SMA w/ period of 50 (fast SMA)
When the fast SMA crosses over the slow SMA in the upward direction – A buy signal is generated. When the fast SMA crosses under the slow SMA in downward direction – A sell signal is generated.
The combination of using a 50 and 200 period SMA is the most widely used period values for this strategy.
Exit signals:
In order to simply measure the distance the price moved after each trading signal. A fixed distance will be used for both the stop loss and take profit, specifically I will be using a multiple of the ATR(Average True Range) which is measurement of volatility. Adjusting for volatility helps to ensure the price distance is realistic relative to market activity.
Its worth noting that the only thing I’m trying to test for is the ability for the signal to have predictive ability in forecasting price direction. When using a stop loss and take profit with the same distance, we have a fair chance in either direction, This helps isolate any influence of a particular direction to the entry signal alone.
Trading execution:
The trading will be taking place as a historical backtest, using a python framework to execute and manage the data collection.
Testing Framework
I will be using the framework described here: Quant Trading Research – Please see that page for more information.
Null Hypothesis Test
Hypotheses Definitions
Essentially we are trying to establish if the MA cross over provides good entry signals or not.
Loosely speaking this is our \(H_1\) – The alternative hypothesis.
However, the word “good” is subjective and it relies on a relative comparison. We need to determine what the comparison will be to.
For an entry signal to be considered bad or poor performing, It would have to provide either the same performance or even worse performance to randomly selecting when to enter a trade.
In summary we are trying to establish if the ma cross over entry signal does or does not provide a significant advantage over random entry signals
The Hypothesis:
- Null hypothesis \(H_0\): The “MA cross over” entry signal does not provide any statistical significance over random trade entries. This is the outcome when no entry strategy is used for entries.
- Alternative hypothesis \(H_1\): The “MA cross over” entry signal does provide statistical significance over random trade entries.
Observed Statistic
I will be using the statistic win rate, as the test/observed statistic.
This measures how often a trade hits the take profit. With the take profit and stop loss being at equal distances. The win rate effectively measures how frequently the trading signal successfully forecasts price direction to a fixed distance.
Observed Statistic: Win Rate
Determine The Parameter Values
A mixture of pre-specified parameters along with some optimization. We will be testing the classic combination of 50 and 200 periods for the SMA indicators.
SMA A period = 50
SMA B period = 200
Because we are using volatility-adjusted exit signals, the other parameter we need to set is the ATR multiple that will be use for the take profit and stop loss.
I will be testing a range of different multiples that will help give an understanding to if the entry signal has an effect on small to larger distances.
ATR multiple: 1,2,3,4,5
Note: If we select the best outcome based on the ATR multiple we are optimizing the strategy by cherry picking the best parameter configuration. This leads to overfitting and additional testing will be required to ensure generalization.
Generating the backtests using real the trading signal
\(H_1\) Back test results.
All 5 backtests contained the exact same SMA period values shown above. Each of these results are based on changes to the ATR multiple alone.
| ATR Multiple | Win Rate | Trade Count |
| 1 | 0.5106 | 282 |
| 2 | 0.5567 | 282 |
| 3 | 0.5426 | 282 |
| 4 | 0.5302 | 281 |
| 5 | 0.5214 | 280 |
The trade count has been kept as consistent as possible, however wider exit targets will mean less trades can take place in the same amount of time.
The best result here is when we are using \(ATR \times 2\) as the take profit and stop loss distance.
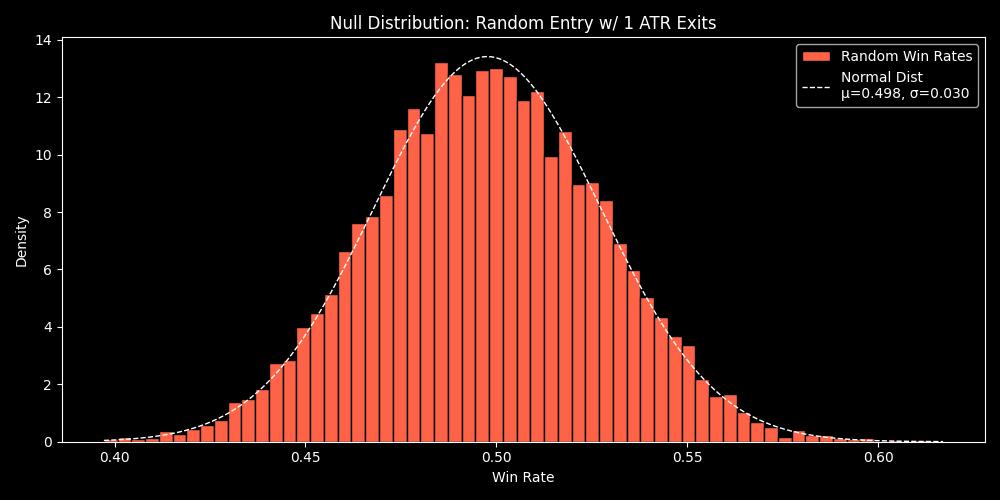
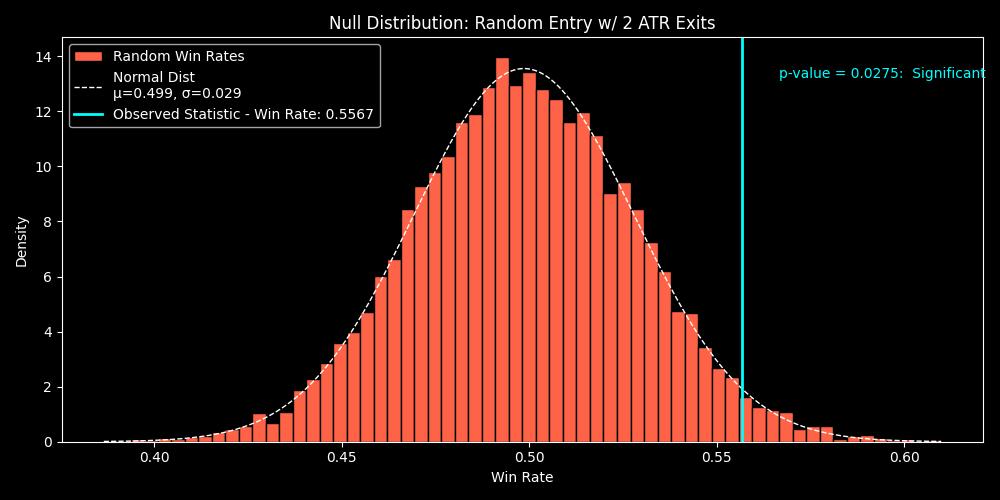
Backtest null hypothesis distribution using random entry
This gives us 10,000 possible outcomes from using the random entry signal.
Evaluate the null hypothesis
When comparing the 5 back tests of different ATR multiples, we can see that the p-value for 4 out of the 5 do not provide any evidence of statistical grounding.
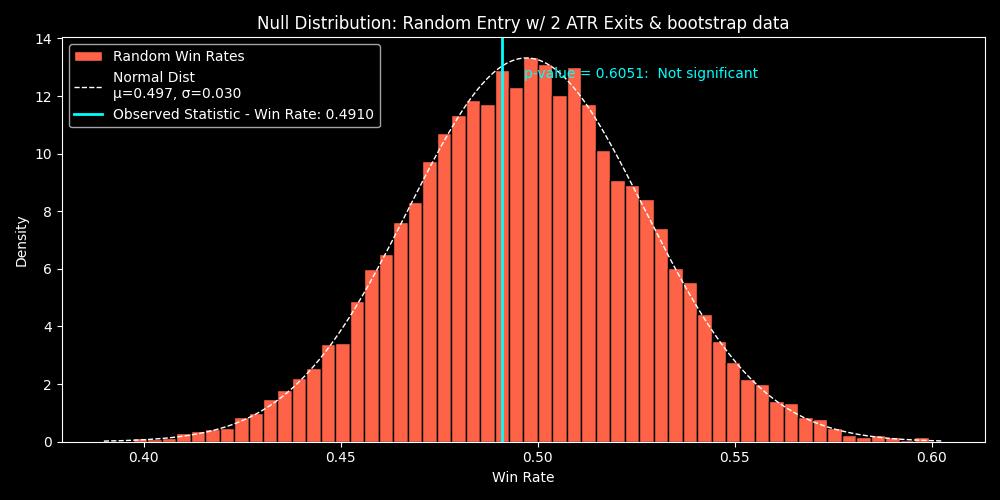
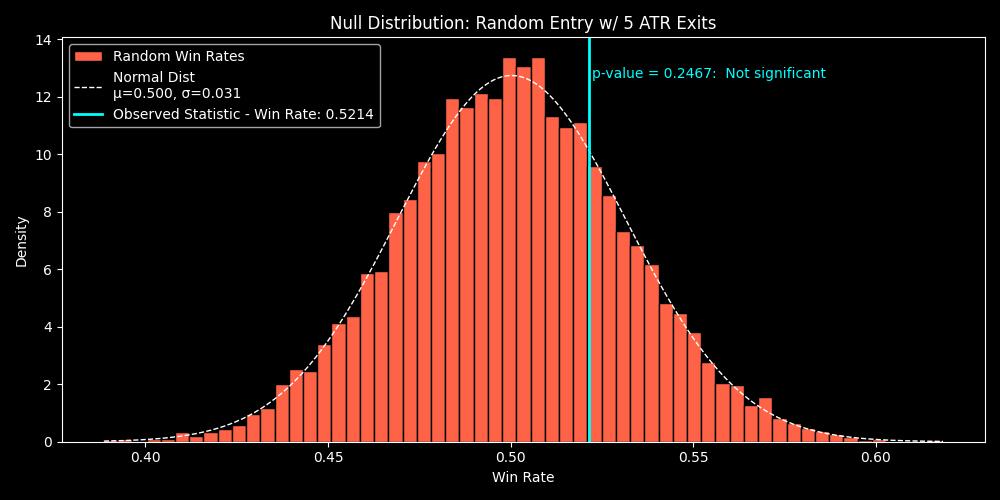
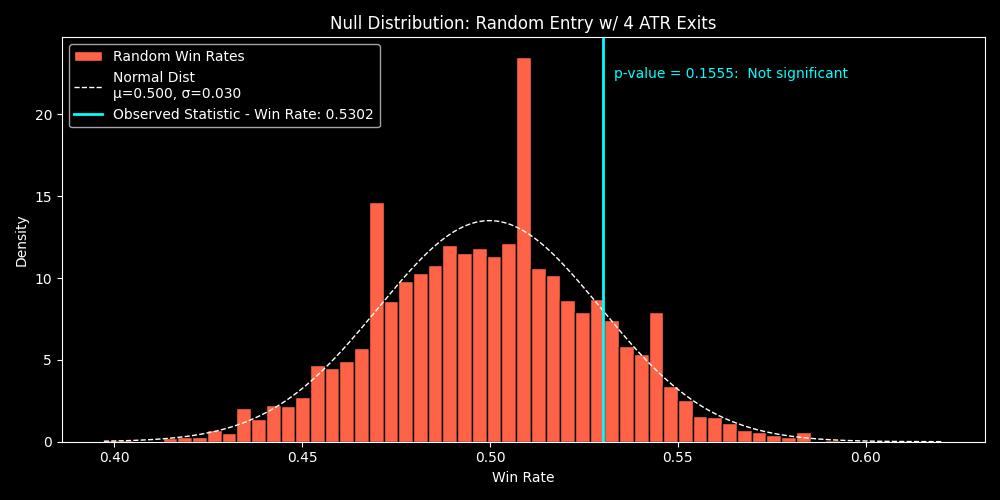
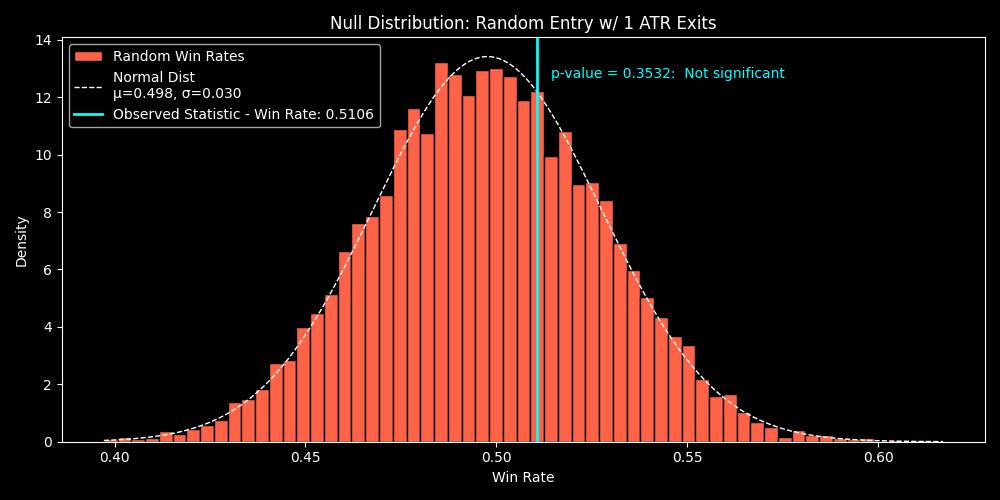
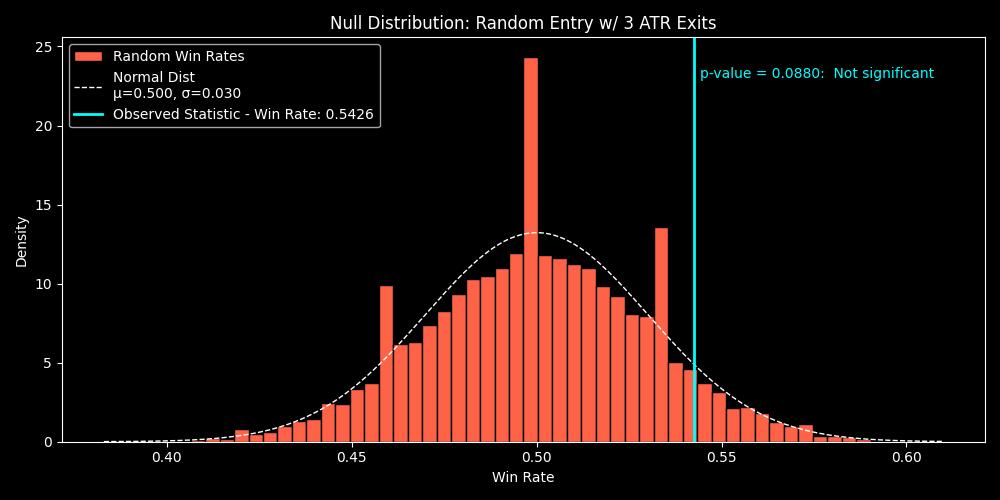
The only results that suggested any evidence of statistical significance was the ATR of 2.
This has inherit bias due to the optimization that occurred to find this ATR value.
The next steps will be to conduct out-of-sample testing to see if this setup is generalized enough or if the results we see here are simply due to overfitting the parameters values.